Meeting the eye
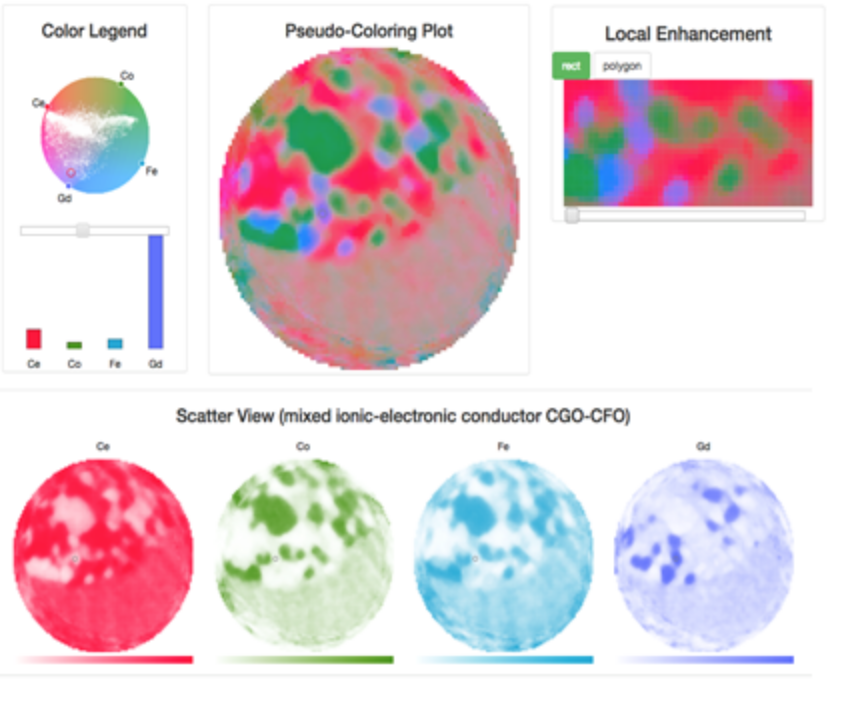
Visualization tools like this one, called Colormap-ND, ease data-analysis. Here, researchers have color coded the individual elements, cerium (Ce), gadolinium (Gd), cobalt (Co) and iron (Fe) in a sample of a solid fuel cells studied on the Hard X-ray Nanoprobe beamline at Brookhaven National Laboratory’s (BNL) National Synchrotron Light Source II. The color mixtures and intensities help researchers find patterns. (Image: BNL.)
Scientific imaging data sets are ballooning in size and complexity. Sophisticated instruments and computers allow researchers to study biological samples and novel energy-storage materials in unprecedented detail. But with so much data researchers face another challenge: finding patterns and extracting maximum scientific value from massive piles of information.
To make sense of all those data, versatile visualization techniques have advanced beyond the traditional graphs and charts scientists use to illustrate their results. These software tools display information so that researchers can harness the unique power of human vision to analyze it. The idea is to “put the human in the center of the analysis,” says Wei Xu, an associate scientist at Brookhaven National Laboratory (BNL). She and her colleagues aim to take imaging data, metadata and other information and create an interactive visual environment that helps investigators analyze and maximize their experiments.
Xu, a computer scientist, started at BNL in 2013 with projects to accelerate and improve X-ray image reconstruction algorithms. But she heard a common complaint from researchers who collected data on Department of Energy Office of Science user facilities at the laboratory. “They didn’t have a good visualization tool for data analysis,” she says.
Xu was in a position to help. While completing her graduate work in Klaus Mueller’s laboratory at nearby Stony Brook University, she’d cultivated a side interest in visualization research. By 2015 she’d shifted her focus to that subject and received a laboratory-directed research and development grant to support the work. The project includes a team of BNL scientists along with Mueller and some of his students.
To design new visualization software, Xu and her colleagues work closely with scientists to understand specific projects’ challenges and desired features. Then the team works to translate researchers’ physics problems into data-centric problems.
Next, Xu and her colleagues focus on converting abstract data, metadata and experiment settings into more meaningful visual representations and interfaces that researchers can understand and work with. They first propose a mockup design, allowing them to discuss necessary adjustments and take into account researchers’ knowledge and preferences. They develop these tools iteratively, she says, writing a first version of the software for demonstration and testing, then revising and refining it until everyone is satisfied.
So far, the team’s work has led to two new software tools. One is associated with BNL’s National Synchrotron Light Source-II Hard X-ray Nanoprobe beamline, which provides a unique set of nanoscale microscopy imaging techniques. It lets researchers examine structural features as small as a dozen nanometers in size, allowing them an unparalleled view of new materials and their molecular properties.
At such high resolution, researchers can map individual elements in space and catalog their properties. But though the instrument can examine eight or more different elements at once, researchers didn’t have a way to view these interactions simultaneously. Instead, they could observe up to three different elements at a time through simple color coding – one element as red, another blue, and a third green.
Brookhaven’s Wei Xu. (Photo: BNL.)
So Xu and her Stony Brook University collaborators created Colormap-ND, an interface that lets researchers color-code four or more elements. Researchers use a circular color space and can assign each element to a major color on the outer edges. They also can use a data-driven approach to assign similar colors to similar elements. Then the compound ratio of elements determines how the major colors are combined. With this mapping, they can translate the various elements in a sample to the elemental color codes. The human eye rapidly detects those color differences, allowing researchers to see variations in the ratios of elements and make scientific discoveries such as new phases and elemental relationships within materials.
This software is already installed in the user facility and produces two-dimensional color maps. But the team isn’t finished. The material samples are in three dimensions, so the team is working to extend the visual mapping from slices to volumes of material, Xu says.
The team also has developed a visualization tool to analyze X-ray scattering data from BNL’s Center for Functional Nanomaterials. In these experiments, material scientists want to examine a process called annealing, the ordering behavior of materials on the nanoscale as they are exposed to heat. A detailed understanding of annealing helps them seek well-ordered structures as they design new materials. During these experiments, the instrument captures the polymer blends, times, temperatures, material thicknesses and patterns of far-field X-rays scattered off the sample.
Bright spots in the data indicate well-ordered nanostructures. Researchers also want to identify blunt spots, which correspond to unsuccessful experiment settings. In addition, properties such as peak locations and widths are extracted from each scattering image for analysis. They combine that information with other features from the experiment, including temperature and time, to form this unique set of data under study.
To aid analysis, the visualization tool lets scientists explore these data in a logical, consecutive arrangement that they can customize. Investigators also want to connect this visual exploration with experimental characteristics and settings, adding an extra way to verify accuracy. The scientists like the idea of combining these visualization schemes and had it in mind from the outset, Xu says, “but they didn’t know how to make it happen.” The new tool is called Multi-Sci-View, for multilevel scientific image exploration with coordinated views. BNL scientists are testing its initial version.
To build even more sophisticated software, Xu wants to incorporate deep-learning algorithms. One critical challenge is integrating different types of imaging data, some that might be acquired on the microscale with other nanoscale information. In addition, some experiments explore chemical states; others dive into materials’ physical properties. Researchers would like to analyze all that information in a single package, but they don’t have a one-size-fits-all tool to unite it and instead must match these data piece by piece to ensure accuracy.
Xu expects that algorithms known as neural networks could overcome these challenges and assemble these disparate data types into a more cohesive whole. She also wants to help researchers look under the hood of these machine-learning methods so they can be sure algorithms generate scientifically consistent results.
These data challenges feed into the ongoing work toward exascale computing. For that reason, Xu’s also a part of a BNL partnership with other labs called CODAR – the Co-Design Center for Online Data Analysis and Reduction at the Exascale. This project is one part of DOE’s Exascale Computing Project, where BNL leads an online performance evaluation framework for scientific workflows called Chimbuko. Xu’s team is developing an online visual analysis and diagnosis interface to help computer scientists identify problematic performance data in high-performance computing clusters.
One set of imaging data from a single sample studied on a BNL beamline can grow to a terabyte, Xu notes. As scientific researchers continue to acquire and integrate more data sets and conduct more sophisticated simulations in supercomputers, they will need data reduction tools coupled with visualizations. That combination will allow them to identify useful information, perform online analysis and steer experiments or online computation.
About the Author
Sarah Webb is science communications manager at the Krell Institute. She’s managing editor of DEIXIS: The DOE CSGF Annual and producer-host of the podcast Science in Parallel. She holds a Ph.D. in chemistry, a bachelor’s degree in German and completed a Fulbright fellowship doing organic chemistry research in Germany.