Supernova shocks
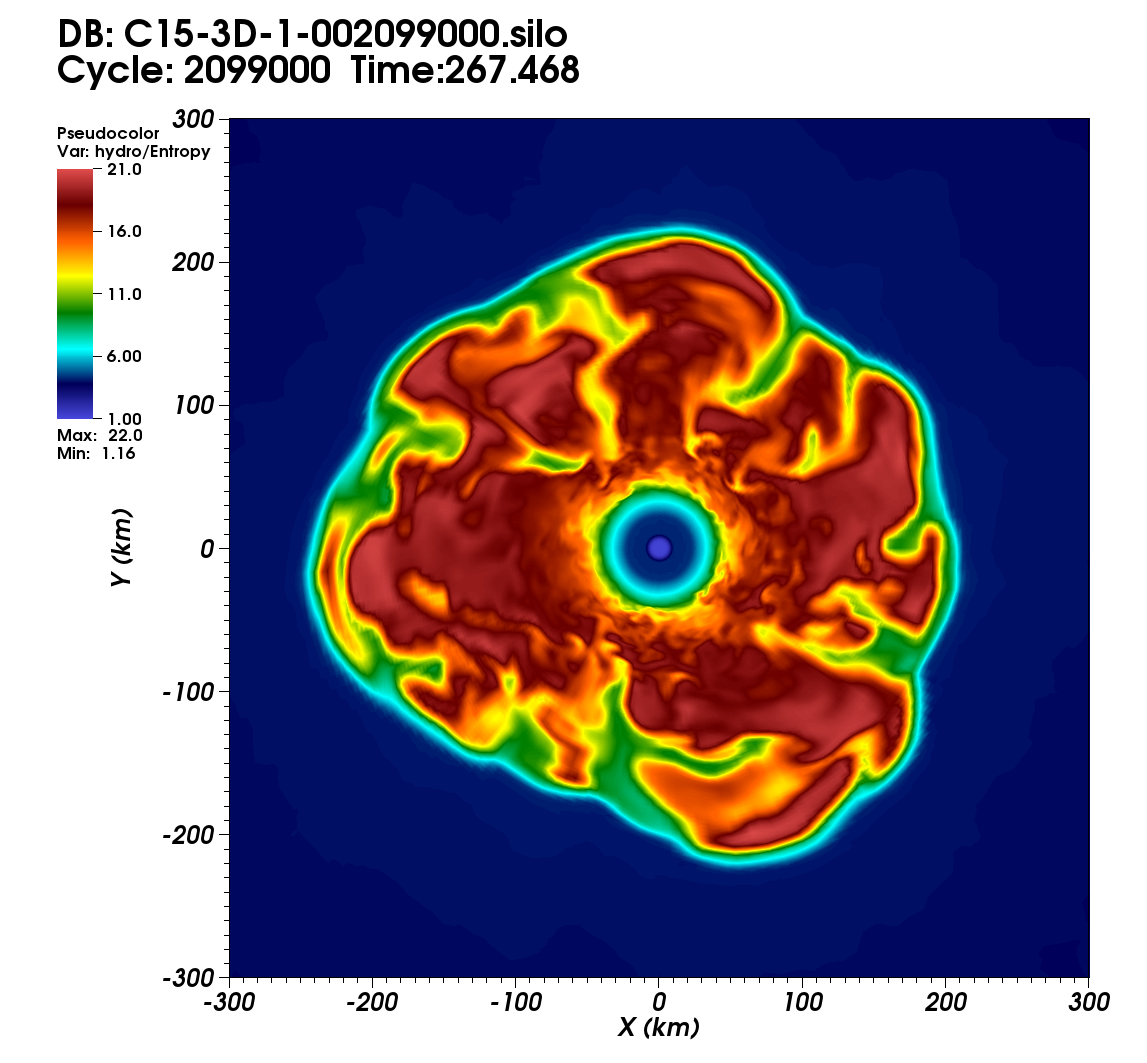
This two-dimensional slice from a three-dimensional visualization of a core-collapse supernova simulation captures a moment about 267 milliseconds after a rebound shock begins to move through the star’s core. The shock radius extends more than 200 kilometers from the center, and its shape distorts. The artificial color tracks the degree of hydrodynamic entropy – or equivalently, temperature – behind the shock. Rising hot (red) plumes – a signature of convection – are evident. The shock is distorted by this convection and by the standing accretion shock instability (SASI), although the SASI has not yet fully developed. The simulation was run Titan, the Cray XK7 supercomputer at Oak Ridge National Laboratory’s Leadership Computing Facility. (Eric Lentz, University of Tennessee, Knoxville.)
The model was configured to start convection then stop it. When the researchers ran the simulation on Eagle, Oak Ridge’s IBM SP3 computer, they found some processes kept going, even after convection stopped.
“That’s when we knew something was up,” Mezzacappa says. “We thought it was a bug in the code. But then John came to realize the shock wave itself was unstable – that we had discovered this new instability.”
Mezzacappa explains: If a spherical shock is pushed or pulled evenly from all directions “it’ll just kind of ring down and settle back to its original location.”
But if the shock is perturbed aspherically – poked or pulled on one side, distorting its round shape – the models showed the distortion keeps growing, even if the initial outside force – perhaps convection, perhaps something else – stops.
“That’s what the SASI looks like,” Mezzacappa says. “The shockwave goes from spherical to being more cigar-shaped, and the fluid [gas and particles] below it is sloshing back and forth further, making it elongate.” In three-dimensional simulations, the distortion is more spherical than elongated but otherwise proceeds similarly.
The growing distortion contributes to neutrino heating, which energizes the final supernova blast, Mezzacappa says.
The team published its conclusions in The Astrophysical Journal in February 2003. Since then, Blondin, Mezzacappa, and their colleagues have continued modeling the SASI in greater detail on successively more powerful machines under DOE Office of Science programs like SciDAC and INCITE. The SASI consistently appears under different conditions and in different models, Mezzacappa says.
Confirmation from the sky
Ten years later, an international team, including scientists from Los Alamos and Lawrence Livermore national laboratories, showed the SASI model probably is right.
This February’s Nature paper, under lead author Brian Grefenstette of the California Institute of Technology, says NuSTAR’s map found titanium-44 distributed through Cassiopeia A in uneven knots. That shouldn’t be so if the explosion was spherically symmetric – going out in all directions. But the knots also aren’t as concentrated as they would be if the star had been rapidly rotating, leading to a bipolar blast with matter jetting out from each magnetic pole.
Christopher Fryer, a Los Alamos computational scientist on the Nature team, helped simulate each of those extreme scenarios. The paper says results indicate nonuniform titanium-44 distribution in Cassiopeia A is “far greater than what can be produced by the spherically symmetric explosion” while the bipolar model can’t reproduce the unevenly distributed titanium-44 knots.
“The supernova is better described by an intermediate case,” the paper concludes: a “multimodal” explosion like one including the SASI, or low-mode convection – large-scale matter circulating in the supernova.
Which scenario is right “is a highly debated topic,” Blondin says. The SASI, Mezzacappa says, is “the most natural, simplest explanation.” Blondin agrees low-mode convection is unlikely to produce something like Cassiopeia A, but thinks such instabilities may come into play as the SASI progresses.
The answers may be in highly detailed, three-dimensional models, like the one Blondin, Mezzacappa and colleagues are running on Titan, Oak Ridge’s Cray XK7. At a theoretical peak speed of 27 petaflops (quadrillion calculations per second) Titan is 27,000 times faster than Eagle’s 1 teraflops.
Nonetheless, three-dimensional core-collapse supernova models remain hugely demanding. The Titan project, led by Oak Ridge and UT computational astrophysicist Eric Lentz, has an INCITE grant of a whopping 85 million processor-hours.
“We’re going to chew through that in one model” run, Mezzacappa says. “We’ll probably be begging for more.”
Editor’s note: This article has been cross-posted on the webzine ASCR Discovery.
About the Author
The author is a former Krell Institute science writer.