Filling in the blanks

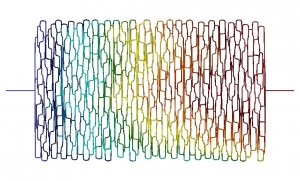
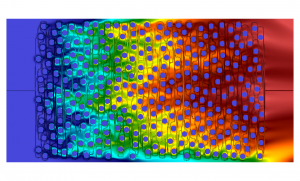
A Reeb graph (above) provides an overview of particle flow during the simulation by summarizing all possible paths of particle flow through a two-dimensional space packed with uniform spheres (right). The technique allows investigators to avoid downloading much of the simulation data. (Lawrence Berkeley National Laboratory.)
Here’s a challenge: Try understanding the action in a movie that has 999 of a thousand frames missing. It might be possible to glean some idea of what’s happening, but the missing frames are likely to contain information crucial to comprehending the plot.
That’s the situation facing high-performance computing (HPC) as it moves to the petascale (quadrillions of calculations per second) and beyond. Many simulations already generate much more data than can be effectively stored and analyzed.
To cope with the situation, researchers sample regular time steps and likely miss interesting behavior. It’s akin to stepping out for popcorn just when Darth Vader tells Luke Skywalker he’s his father. Nothing that happens afterward makes much sense without the missing information.
This disconnect is inspiring Lawrence Berkeley National Laboratory’s visualization group to create a new generation of data analytics and visualization to meet that challenge.
As HPC reaches toward the exascale (a thousand times faster than petascale), a vastly increased number of essentially independent computing cores will make data movement a major bottleneck, says Gunther Weber, a research scientist in the Berkeley Lab visualization group. The current pattern of serially running a large simulation, dumping the data to disk and then doing post-processing analytics and visualization must change, he says; analytics will need to be built into simulations.
As a first step toward that goal, Weber and his research team are embedding data analytics into NYX, a simulation used to explore the behavior of matter in deep space. NYX, developed by Ann Almgren and her colleagues at the lab’s Center for Computational Sciences and Engineering, uses a technique called adaptive mesh refinement in a nested hierarchy of uniform grids that follows matter distribution in both space and time. The cosmology simulations, led by Peter Nugent, Berkeley Lab senior staff scientist, aim to pin down the balance of forces that lead to matter clustering that matches deep space observations. (See sidebar, “Going deep.”)
“These are large, large simulations,” Nugent says. “You need to have the analysis tools embedded in the simulation because you can’t dump out this data every single time step and look at things. Any time you move from memory to somewhere else, it’s painful.”


