Nuclear predictive

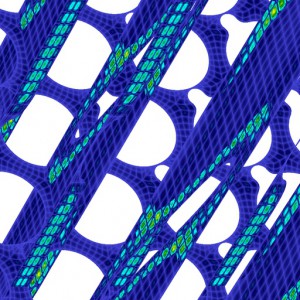
This visualization is a close-up of a 1 billion gridpoint mesh used to simulate a 217-pin nuclear fuel bundle. Each square – just a few of 3 million – is comprised of an 8 by 8 grid of points. The simulation calculates values such as pressure, temperature and turbulence at each point, providing engineers with insights into reactor coolant flow. The simulation used tens of thousands of processors on Argonne National Laboratory’s IBM Blue Gene/P supercomputer.
Innovative at the time, the experiments nonetheless could only crudely approximate what would happen with temperature, pressure and vibrations inside the core. The scientists therefore built in a large safety margin, a fudge factor that cut the risk of meltdowns by lowering the maximum temperatures for reactor operation. That fudge factor greatly compromised the efficiency of the reactors. The fact they weren’t burning anywhere near the safest peak temperatures also meant they weren’t producing as much energy as was feasible.
Today’s scientists know a lot more about the physics of nuclear reactors and about the physics of what happens to materials inside them. “We’ve demonstrated with nuclear weapons that we can certify and characterize their behavior using high-performance parallel computers,” Tautges says. “It’s a natural progression to apply that same technology to nuclear reactors.”
Two realities haven’t changed: safety and cost.
Utility companies don’t want to build a reactor that has been tested for safety using only the coarse experiments of the past. And they can’t afford to build a reactor that is tested to the limits of science – to the billions and billions of data points calculating the temperature, pressure and velocity through the enormous plant.
That’s where Fischer and the SHARP team come in, with simulations that can provide data and insight previously accessible only via expensive and extremely time-consuming experiments.
They’re known as large-eddy simulations because they try to capture the most significant parts of turbulent motion, the large ones, without resolving the smaller movements. “You use a model to capture the smaller scales of motion,” Fischer says. “Otherwise you would need a lot more points than what we have.”
Ultimately, the simulations can assess the uncertainty of the data points, a key factor in determining plant safety. “We can tell whether we are on an equilibrium point, whether we are stable or unstable,” Tautges says.
To know the flow
Fischer’s research looks at the thermal hydraulics of reactors, whether the flow is water in the case of light-water reactors, liquid sodium in the case of fast reactors or helium in the case of very fast gas-cooled reactors.
“We want to answer several questions: What is the peak temperature in the reactor, where does it occur and under what circumstances?” Fischer says.
Fischer’s team has built a computational model with a mesh of grid points at which temperature, speed of the flow and fluid properties are known. The SHARP project also has nuclear engineers working on a computational model to simulate neutron transport, or what happens with fissionable material, the source of heat in a nuclear reactor. Fischer’s computational model aims to determine how the heat moves and is conducted when the fuel pin heats up.
“We solve a partial differential equation governing the heat transport,” Fischer says. “It also requires computing the flow of the coolant, which is the principal challenge.” The simulation involves 1 billion grid points for one fuel assembly. “We need that many grid points to capture the small features of the flow,” Fischer says, “since each point can vary in velocity and pressure because the flow of the fuel is so turbulent.”
His 217-pin rod-bundle simulation, the one that involves 65,000 processors, requires 30 million hours of computer time on the IBM Blue Gene/P through DOE’s INCITE program (for Innovative and Novel Computational Impact on Theory and Experiment).
“It’s a big calculation,” Fischer says, “20 times larger than we were doing two years ago.”
Fischer’s video depiction of the simulation presents slices through a multi-pin mesh, divided into squares that look like plaid shirts, each containing an 8 by 8 grid of points. There are 3 million such little bricks, with the points spread over a space 10 centimeters on a side and 50 centimeters long.
Other scientific teams have done seven-pin calculations, but no one else has attempted the 217-pin simulation.
“Even this calculation doesn’t capture everything,” Fischer says. “But it’s certainly the most detailed to date.”
The next step is to compare the 217-pin data with the seven-pin data. The researchers aim to validate less expensive models and the experiments done in the 1970s.
“Once we’re all on the same page,” Fischer says, “people will be comfortable that we have validated the process to predict the behavior of these devices.”
About the Author
Bill Scanlon was a reporter at the Rocky Mountain News until its closing in February 2009.


