
When Zhenyu “Henry” Huang considers the grid of power sources and wires that supplies electricity to the United States, he doesn’t see a network so much as he sees a giant machine.
And it’s straining to keep up.
“The power grid is doing things today which it was not designed for,” says Huang, a senior research engineer in the Energy Technology Development Group at Pacific Northwest National Laboratory, a Department of Energy facility.
“If something serious happens in the system, it can wipe out a whole region in a few seconds,” Huang says. “That’s why we want to think about how we can respond to those situations more quickly, and that’s why we want to look into high-performance computers to help us.”
Huang and fellow PNNL researchers are developing ways for powerful computers to quickly analyze which failures can combine to most threaten the grid. When multiple components break down, the consequences can be devastating, such as the massive blackout of the northeast United States and Ontario in 2003.
The risk of repeating such a giant failure is increasing as the power system copes with a list of major challenges – including rising demand on a grid that already operates near capacity.
Most of the problems stem from power systems’ high-wire balancing act. “You cannot store a large amount of power like you can store computers in a warehouse,” Huang says. Demand and production must always be roughly equal. Too much or too little generation can cause overloads, brownouts and blackouts.
The addition of renewable energy sources like wind and solar tests that balance. Passing clouds can make solar generation fluctuate; winds can suddenly accelerate or die, boosting or idling turbines. Power companies must quickly redistribute traditional generation to compensate.
Thinking fast
Power company employees and computers monitor the grid at large control centers. To cope with problems, they adjust generation and open or close lines and transformers to meet demand and reroute power.
That’s not good enough, Huang says. To avoid catastrophic incidents, utilities must be able to quickly analyze how failures affect the system.
A power system’s character completely changes over a period of hours, but usually does so slowly, says John Allemong, principal engineer for American Electric Power, an Ohio-based utility that owns the nation’s largest transmission system. However, “There are topological changes that occur fairly frequently,” he adds. “When those do occur it’s a good idea to get a handle on where you are fairly quickly. The ability to do so would be a plus.”
There are two parts to each system analysis, Allemong says:
State estimation, which takes measurements of electrical quantities on the system and, knowing the structure of the network, figures out what the measured quantities should be. The calculated values are then compared against the measured values. The end result is an estimated grid state based on the measurements.
Contingency analysis, which computes the power grid’s condition if there are topological changes – particularly if transmission lines, transformers or generators go out of service. “That will cause the flows to all redistribute, so you’d better know whether any of those conditions can cause violations” of line and transformer thermal limits and voltage limits, Allemong says.
“In order to do the contingency calculations you have to know what the state of the network is in both topology and flows. State estimation does that,” Allemong says. “Once you have that model of flows and voltages, you compute a bunch of these outage or topology changes and what the resultant conditions would be.”
The standard analysis for today’s grid operators is a single contingency – cases involving the failure of just one component. In power grid terms, that’s an “N-1” contingency case. “N” represents the total number of elements in the system and 1 is the total number of elements to fail.
“Usually, for power grid operation if you lose one element, the system should be able to maintain stability,” Huang says. But as in the 2003 outage, blackouts can be caused by multiple failures – an “N-x” contingency case.
Insurmountable problems
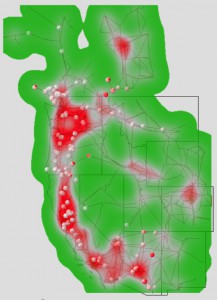
That makes the problem huge. For example, there are about 20,000 components in the Western Electricity Coordinating Council (WECC) system serving nearly 1.8 million square miles in the western United States and Canada. N-1 contingency analysis, therefore, requires considering 20,000 cases.
Analyzing the impact of any combination of just two WECC components (N-2 contingency analysis) failing means considering an exponentially larger number of cases – roughly 108 or 100 million cases, Huang and his colleagues, Yousu Chen and the late Jarek Nieplocha, wrote in a paper for the July 2009 meeting of the IEEE Power and Energy Society.
Analyzing possible combinations of three or more components (N-x cases) makes the problem so large even the most powerful high-performance computers couldn’t solve it quickly enough to provide useful results.
But not all grid components are created equal – a fact that lets Huang and his fellow researchers make the problem more manageable. Their contingency analysis algorithm treats the grid as a weighted graph and applies the concept of “graph betweenness centrality” to identify the most traveled paths between locations. Then it analyzes cases involving only the most critical transmission lines and components.
Components identified as having little impact on grid stability are removed from the analysis, making the problem tractable with available computing power.
The researchers’ method breaks contingency analysis into two steps: selection and analysis. That makes it well suited to run on PNNL’s Cray XMT, a computer based on “massively multithreaded” architecture. See sidebar.
It’s clear grid operators must quickly analyze multiple contingencies and take action to block problems – and that the job will take considerable computing power, even when graph analysis discards less damaging scenarios.
Allemong says grid management organizations typically analyze contingencies every few minutes, but most results are inconsequential. Efforts to get at only significant cases have had limited success, but with the weighted graph approach, “maybe Henry is on to something.”